How Many Carbs Per Day? Daily Grams by Goal
How many carbs per day depends on your calories and your goal, and the standard range is 45% to 65% of calories. At 2,044 calories that is 230 to 332 g, and the calculator’s maintenance default of 246 g sits inside it. The RDA of 130 g is a minimum for brain fuel, not a target. Fat loss, muscle gain and heavy training each move the number up or down.
This page shows how many carbs you should eat a day, in grams by calorie level, goal and activity. It also covers low-carb, moderate and high-carb bands, athlete needs per kg and how to judge carb quality. To get your own number, use the free macro calculator.

How Many Carbs Per Day? The Short Answer
Most healthy adults fall between 45% and 65% of calories from carbohydrate, the Acceptable Macronutrient Distribution Range set by the National Academies. Carbohydrate gives 4 calories per gram, so the range converts to grams with one formula: calories × share ÷ 4. On a 2,000 calorie pattern that is about 225 to 325 g.
Two other numbers matter. The RDA for carbohydrate is 130 g a day for adults, an amount based on the brain’s glucose use rather than a goal. The FDA Daily Value for total carbohydrate is 275 g on a 2,000 calorie diet. It is a label reference, not a recommendation for you.
In practice, carbohydrate is what remains after protein and fat are set. That is why how many carbs per day you need moves with calories, goal and activity. The sections below give grams by calorie level instead of one figure. For a protein-first approach, see how much protein per day.
How Many Grams of Carbs Per Day by Calorie Level
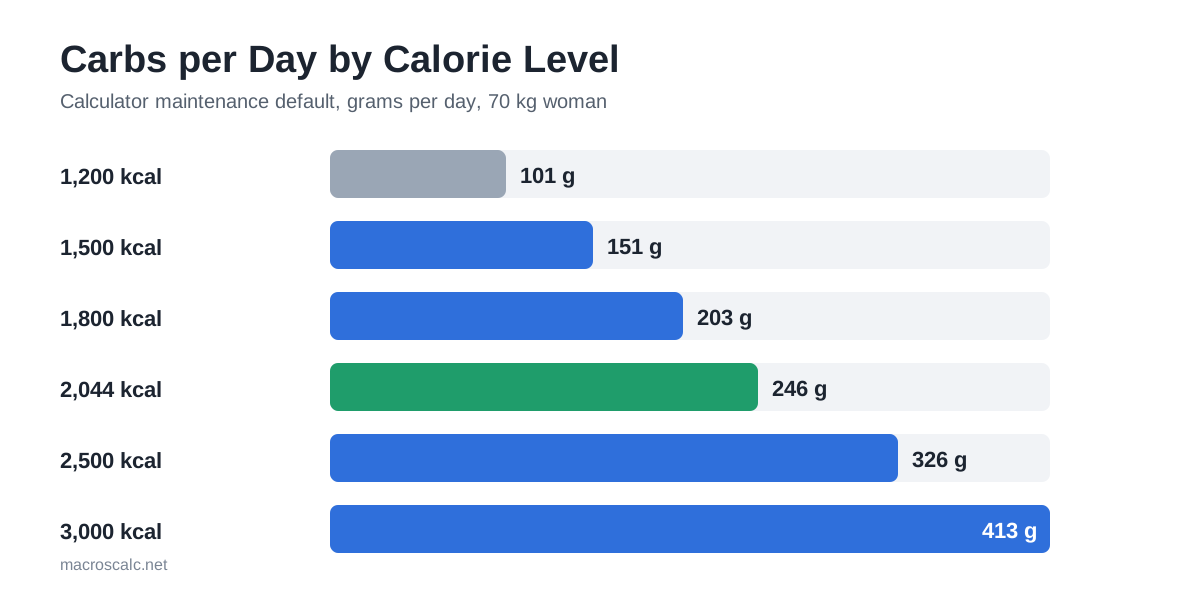
The table converts the 45% to 65% range to grams at six calorie levels. That shows how many carbs per day each level supports. The last two columns show the calculator’s maintenance default for the 70 kg woman. It sets protein at 1.6 g per kg and fat at 30% of calories.
Calories | 45% of calories | 65% of calories | Calculator default | Default share of calories |
|---|---|---|---|---|
1,200 | 135 g | 195 g | 101 g, flagged | 34% |
1,500 | 169 g | 244 g | 151 g | 40% |
1,800 | 203 g | 293 g | 203 g | 45% |
2,044 | 230 g | 332 g | 246 g | 48% |
2,500 | 281 g | 406 g | 326 g | 52% |
3,000 | 338 g | 488 g | 413 g | 55% |
At low calories the default falls below the 45% line, because protein and fat take a larger share. That is by design, not an error. The official range describes eating patterns across a population, while a protein-first plan protects protein at any calorie level.
At 1,200 calories the calculator raises fat to its minimum and caps protein at 35%. That leaves 101 g of carbohydrate and a flag. Very low calories are an edge case the calculator flags, not a target to aim for.
Fat is set alongside carbohydrate, and how many grams of fat per day gives its range by calorie level.
How Many Carbs Per Day by Goal and Activity
Goal and activity change calories, and calories change carbohydrate. The table shows the calculator’s defaults for the 70 kg woman at a moderate activity factor of 1.465, where maintenance is 2,044 calories. Protein is set per kg for each goal, so carbohydrate moves with the calorie target.
Goal | Calories | Protein | Carbohydrate | Fat |
|---|---|---|---|---|
Fat loss, default | 1,635 | 140 g | 167 g | 45 g |
Fat loss, 0.5 lb a week | 1,794 | 140 g | 196 g | 50 g |
Maintenance | 2,044 | 112 g | 246 g | 68 g |
Recomposition | 2,044 | 140 g | 243 g | 57 g |
Muscle gain, default | 2,248 | 126 g | 296 g | 62 g |
Carbohydrate runs from 167 g in a deficit to 296 g in a surplus, a swing of 129 g. The goal guides give the full method for each. See macros for weight loss for deficits and macros for muscle gain for surpluses.
Activity works the same way through calories. The table keeps the woman at maintenance and changes only the activity factor.
Activity level | Factor | Calories | Carbohydrate | Carbs per kg |
|---|---|---|---|---|
Sedentary | 1.2 | 1,674 | 181 g | 2.6 g/kg |
Light | 1.375 | 1,918 | 224 g | 3.2 g/kg |
Moderate | 1.465 | 2,044 | 246 g | 3.5 g/kg |
Active | 1.55 | 2,163 | 267 g | 3.8 g/kg |
Very active | 1.725 | 2,407 | 309 g | 4.4 g/kg |
The same profile needs 128 g more carbohydrate when moving from sedentary to very active. The change comes through calories, with protein and fat nearly fixed. How the calories are estimated is explained in BMR and TDEE.
Carbs for Athletes and Hard Training
Athletes and hard trainers often settle how many carbs per day they need by setting carbohydrate per kg of body weight. Burke and colleagues described ranges that rise with training load.
They run from about 3 to 5 g per kg for light training. Very heavy loads need 8 to 12 g per kg. For a 70 kg adult that is 210 to 350 g on light days and 560 to 840 g at the extreme.
Most people are nowhere near the high end. Match carbohydrate to your hardest sessions. Use the option in carb cycling if you want more on training days and less on rest days.
How Many Carbs Per Day Counts as Low, Moderate or High?
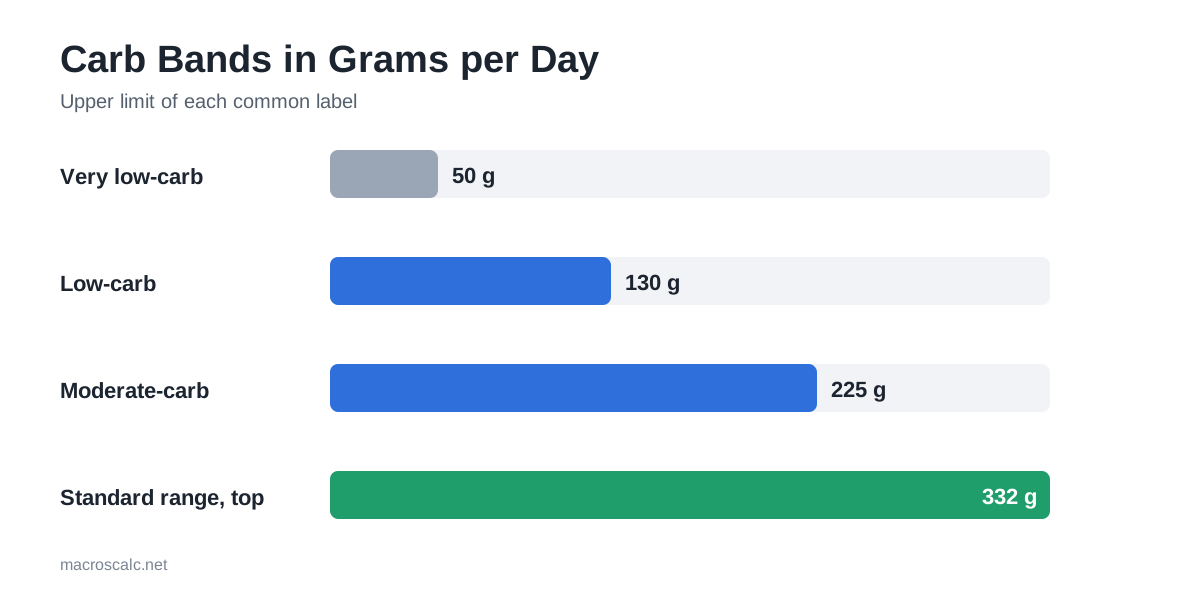
There is no official definition of a low-carb diet, but common labels use the bands below. They are rules of thumb used by guides and researchers, not medical categories. Most use grams per day regardless of body size.
Label | Grams per day | Share of 2,044 calories |
|---|---|---|
Very low-carb or keto | 20 to 50 g | 4% to 10% |
Low-carb | 50 to 130 g | 10% to 25% |
Moderate-carb | 130 to 225 g | 25% to 44% |
Standard range for how many carbs per day | 230 to 332 g | 45% to 65% |
High-carb | Above 332 g | Above 65% |
Moving from the standard range to a low band means giving up most starchy foods and fruit. Keto-level intakes are covered in keto macros, where carbohydrate is set first and fat fills the rest. Low-carb is a style, not a requirement. The evidence for weight loss comes mostly from the calorie deficit that usually comes with it.
Carb Quality: Fibre, Sugar and Which Carbs Count
Grams are only half the picture. Carbohydrate comes as sugars, starches and fibre, and the mix matters for fullness, blood sugar and nutrients. Fibre is the part that does not give usable energy in the same way, which is why it is counted separately.
The National Academies set adequate fibre intakes at about 25 g a day for women and 38 g for men under 50. The FDA Daily Value is 28 g. Most adults eat less.
The Dietary Guidelines for Americans 2025 to 2030 advise cutting highly refined carbohydrate. They say no amount of added sugars is recommended, with no more than 10 g in a single meal. That is stricter than the older limit of 10% of calories, which works out to about 51 g a day at 2,044 calories.
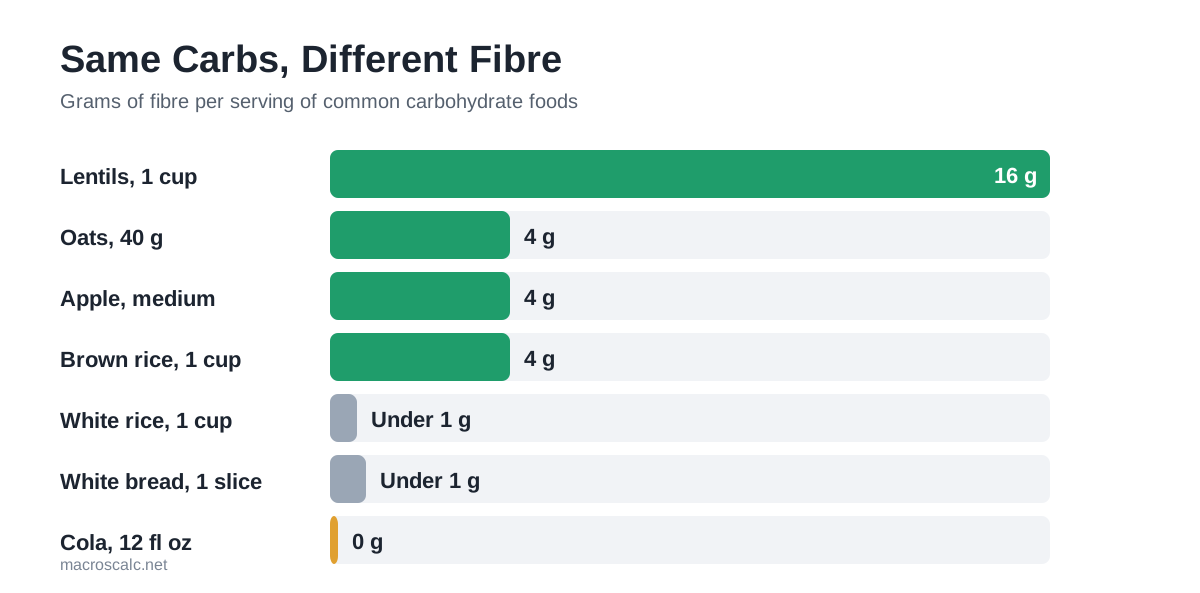
Food | Serving | Carbohydrate | Fibre |
|---|---|---|---|
Rolled oats, dry | 40 g | About 27 g | About 4 g |
Lentils, cooked | 1 cup | About 40 g | About 16 g |
Apple, medium | 1 | About 25 g | About 4 g |
Brown rice, cooked | 1 cup | About 45 g | About 4 g |
White rice, cooked | 1 cup | About 45 g | Under 1 g |
White bread | 1 slice | About 14 g | Under 1 g |
Cola | 12 fl oz | About 39 g | 0 g |
The table shows why the gram total hides differences. A cup of lentils and a can of cola carry about the same carbohydrate. The lentils also bring 16 g of fibre plus protein. Build most of your carbohydrate from whole foods, and let sugary drinks and refined snacks be the smaller share.
Counting carbs does not mean counting only grams. If your plan hits the grams but misses fibre, swap refined carbohydrate for oats, beans, fruit or vegetables. The macros barely change and the nutrients improve. Values are rounded from USDA FoodData Central and vary by brand.
Simple vs Complex Carbs: Which Should You Eat?
Simple carbohydrates are sugars: one or two sugar units such as glucose, fructose, sucrose and lactose. Complex carbohydrates are starches and fibre, long chains of sugar units that take longer to break down. Sugars and starch both give about 4 calories per gram, so the split does not change the carbohydrate number the calculator gives you. It changes what that number does to fullness and blood sugar.
The simple vs complex carbs label is a rough guide, not a verdict. Whole fruit and plain milk are simple carbohydrates, yet they arrive with fibre, water, protein or calcium. White bread and white rice are complex carbohydrates on paper, but milling removes most of the fibre, so they digest quickly. Fibre content and how processed a food is predict the effect better than the simple or complex tag.
Type | What it is | Common sources | Fibre |
|---|---|---|---|
Simple, natural | Sugars packaged with water, fibre or protein | Whole fruit, plain milk and yoghurt | Some in fruit, none in milk |
Simple, added | Sugars added in processing or at the table | Cola, sweets, sweetened cereal, syrups | None |
Complex, whole-food | Starch with the fibre still intact | Oats, lentils, beans, whole grains | High |
Complex, refined | Starch with most of the fibre milled away | White bread, white rice, many crackers | Low |
Added sugar is the one place the guidelines draw a hard edge. Added sugars sit inside your carbohydrate grams, so trimming them leaves room for complex carbohydrates without changing the total. The 51 g figure above is the old ceiling, not a target.
A practical rule: take most carbohydrate grams from complex carbohydrates that keep their fibre. Keep fruit and dairy as your natural simple carbs, and treat added sugar as the part to trim. For the wider picture of how carbohydrate fits with protein and fat, see what are macros.
Worked Examples: Carbs for a Man and a Woman
These examples use the maintain goal with protein at 1.6 g per kg and fat at 30% of calories. They show how the same method gives different carbohydrate for different bodies.
Example A: 70 kg Woman at Three Calorie Levels
At 1,500 calories she gets 151 g of carbohydrate, which is 40% of calories. At 2,044 calories she gets 246 g, or 48%. At 2,500 calories she gets 326 g, or 52%. Protein stays at 112 g in all three, so every extra calorie goes to carbohydrate and fat.
The official range at 2,044 calories is 230 to 332 g, so the 246 g default sits comfortably inside. At 1,500 calories it sits below the 45% line, which is the protein-first effect described earlier.
Example B: 82 kg Man, Three Goals
A 28-year-old man at 180 cm and 82 kg gets 257 g of carbohydrate at the fat-loss default of 2,244 calories. He gets 360 g at maintenance of 2,806 and 431 g at the muscle-gain default of 3,086. Protein is 164, 131 and 148 g in those three cases. Carbohydrate is the macro that absorbs the energy change.
His maintenance carbohydrate is 51% of calories, inside the standard range, while the gaining figure is 56%. Both fit the official band. The interpretation is the same as for the woman: calories move carbohydrate, and the share is an output.
How to Interpret Your Daily Carb Intake
Treat your answer to how many carbs per day as a starting estimate. Use it for two to three weeks, then check your weight trend, energy and training. If hard sessions feel flat, add carbohydrate before them and take calories from fat. If you feel hungry on a low number, raise fibre and protein before you raise carbohydrate.
Do not chase an exact percentage. A day within about 10% of the target is close enough, and the weekly average matters more. If you have diabetes or take glucose-lowering medication, set carbohydrate with a clinician, because the numbers here are estimates for healthy adults.
FAQs
Conclusion
How many carbs per day comes down to calories, goal and activity, with 45% to 65% of calories as the standard range. Set protein and fat first, let carbohydrate take the remainder and check the result against your weight trend and energy. The 130 g RDA is a floor, not a goal.
Use the macro calculator to see your own number alongside protein and fat. If you want the full method, read how to calculate macros, and for the three-macro basics see what are macros.
Sources
The ranges and figures on this page come from the sources below and from USDA FoodData Central for food values. Check the originals if you plan to rely on a specific number.
Every worked example was calculated with the same engine the macro calculator uses. Band labels such as low-carb are common conventions, not official definitions.