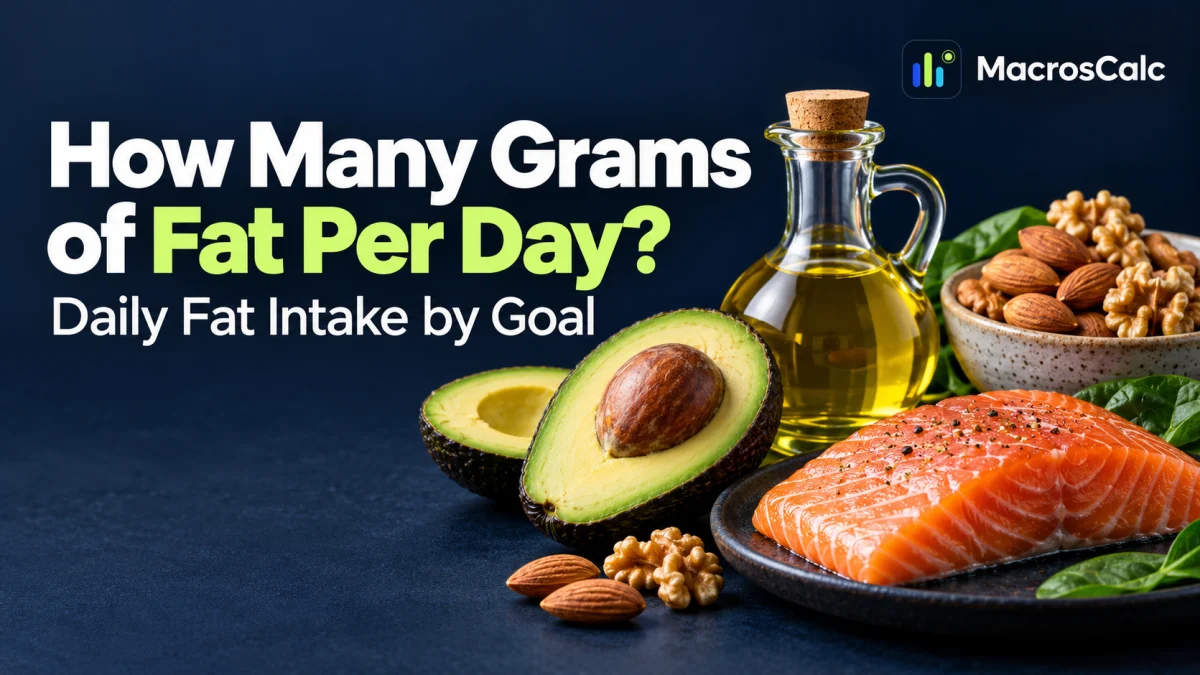
How Many Grams of Fat Per Day? Daily Fat Intake by Goal
How many grams of fat per day depends on your calories, and the standard range is 20% to 35% of calories. At 2,044 calories that is 45 to 79 g, and the calculator’s maintenance default of 68 g sits inside it. Fat gives 9 calories per gram, so the same percentage means fewer grams than carbohydrate or protein. Saturated fat has its own ceiling of 10% of calories.
This page shows how much fat per day fits each calorie level, goal and fat type. It also covers saturated fat limits, the two essential fats and food sources in grams. To get your own number, use the free macro calculator.
How Many Grams of Fat Per Day? The Short Answer
Most healthy adults fall between 20% and 35% of calories from fat, the Acceptable Macronutrient Distribution Range set by the National Academies. Fat gives 9 calories per gram, so the range converts to grams with one formula: calories × share ÷ 9. On a 2,000 calorie pattern that is about 44 to 78 g.
Two limits sit inside that range. The Dietary Guidelines for Americans 2025 to 2030 keep saturated fat under 10% of calories, which is about 22 g at 2,000 calories. The American Heart Association aims lower, at about 6% or 13 g. There is no RDA for total fat, but there are adequate intakes for two essential fatty acids, covered below.
In practice, fat is set after protein, which is why how much fat per day you need moves with calories and goal. The sections below give grams by calorie level instead of one figure. For the protein side, see how much protein per day, and for how the three macros fit together, see macro ratios.
How Many Grams of Fat Per Day by Calorie Level
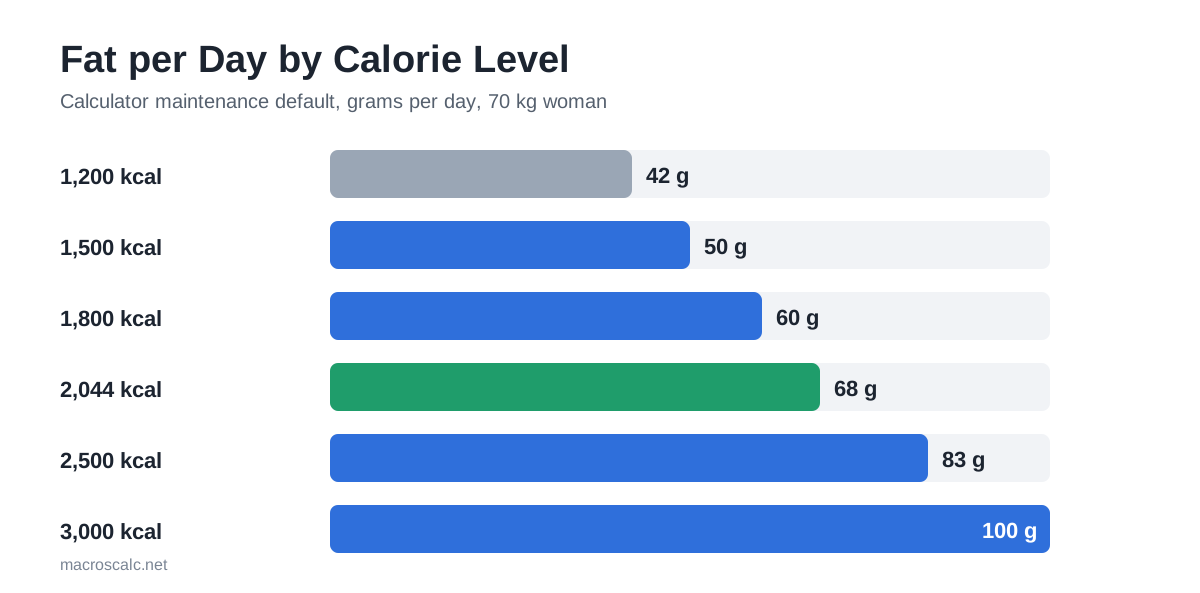
The table converts the 20% to 35% range to grams at six calorie levels. That shows how much fat per day each level supports. The last two columns show the calculator’s maintenance default for the 70 kg woman. It sets protein at 1.6 g per kg and fat at 30% of calories.
Calories | 20% of calories | 35% of calories | Calculator default | Default share of calories |
|---|---|---|---|---|
1,200 | 27 g | 47 g | 42 g, floor | 32% |
1,500 | 33 g | 58 g | 50 g | 30% |
1,800 | 40 g | 70 g | 60 g | 30% |
2,044 | 45 g | 79 g | 68 g | 30% |
2,500 | 56 g | 97 g | 83 g | 30% |
3,000 | 67 g | 117 g | 100 g | 30% |
Every default sits inside the standard range. At 1,200 calories the calculator holds fat at its floor of 0.6 g per kg. That is 42 g for 70 kg, a little above the 30% line. Very low calories are an edge case the calculator flags, not a target to aim for.
How Much Fat Per Day by Goal
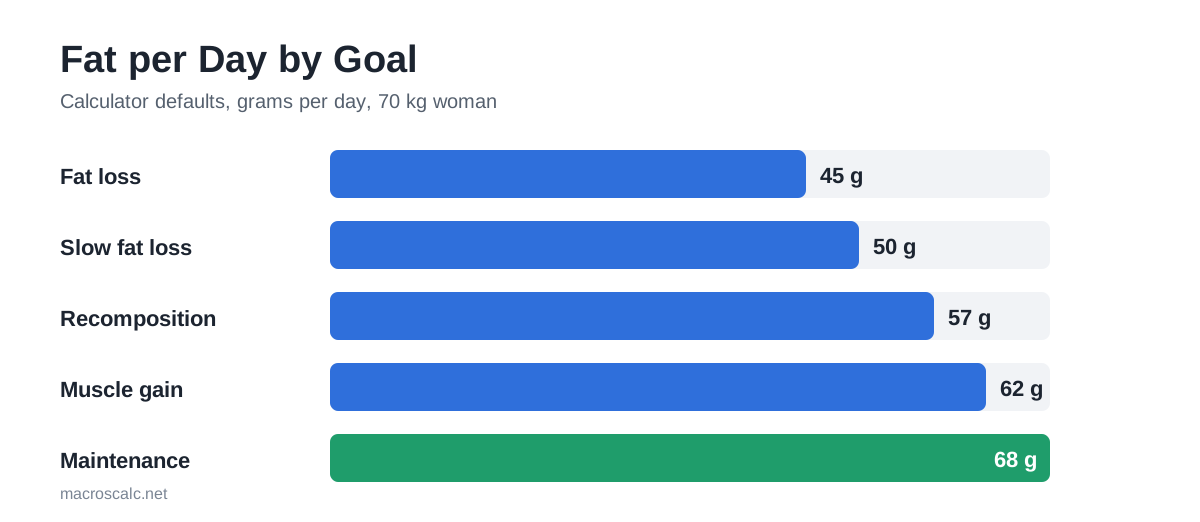
Goal changes calories, and the calculator also changes fat’s share. Maintenance uses 30% of calories from fat. Fat loss, recomposition and muscle gain use 25%, which leaves more room for protein and, in a surplus, for carbohydrate. The table shows the defaults for the 70 kg woman at a moderate activity factor of 1.465, where maintenance is 2,044 calories.
Goal | Calories | Protein | Fat | Fat share | Fat per kg |
|---|---|---|---|---|---|
Fat loss, default | 1,635 | 140 g | 45 g | 25% | 0.64 g |
Fat loss, 0.5 lb a week | 1,794 | 140 g | 50 g | 25% | 0.71 g |
Maintenance | 2,044 | 112 g | 68 g | 30% | 0.97 g |
Recomposition | 2,044 | 140 g | 57 g | 25% | 0.81 g |
Muscle gain, default | 2,248 | 126 g | 62 g | 25% | 0.89 g |
Fat runs from 45 g in a deficit to 68 g at maintenance. Muscle gain sits at 62 g, below maintenance, because the share drops to 25% and the extra calories go mainly to carbohydrate. See macros for weight loss for the deficit method, and BMR and TDEE for how the calorie targets are estimated. Keto sets fat far higher, as the keto macros guide shows.
The calculator also lets you set fat anywhere from 20% to 40% of calories. The table shows what each setting means in grams at 2,044 calories for the same 70 kg woman.
Fat share | Grams per day | Grams per kg | Where it sits |
|---|---|---|---|
20% | 45 g | 0.64 g | Bottom of the standard range |
25% | 57 g | 0.81 g | Default for fat loss, recomposition and muscle gain |
30% | 68 g | 0.97 g | Maintenance default |
35% | 79 g | 1.13 g | Top of the standard range |
40% | 91 g | 1.30 g | Above the range, the calculator’s upper setting |
Minimum Fat and the Two Essential Fats
There is no RDA for total fat. The practical floor comes from the 20% lower end of the standard range and from the essential fats. The calculator adds its own safeguard of 0.6 g per kg, a built-in rule rather than a published requirement. That is 42 g for the 70 kg woman and 49 g for the 82 kg man.
Two fats cannot be made by the body: linoleic acid, an omega-6, and alpha-linolenic acid, or ALA, an omega-3. The National Academies set adequate intakes for adults aged 19 to 50. Men get 17 g of linoleic acid and 1.6 g of ALA a day, and women get 12 g and 1.1 g.
One ounce of walnuts covers the ALA figure for either sex, and fatty fish adds EPA and DHA, the long-chain omega-3s. Fat also helps the body absorb vitamins A, D, E and K. That is another reason not to cut it to the floor for long.
Saturated, Unsaturated and Trans Fat: Which Fats Count?
Total grams are only half the picture. Fat comes as monounsaturated, polyunsaturated, saturated and trans fat, and the guidance differs for each. The advice behind the saturated fat limits is a swap, not a cut. Replace saturated fat with unsaturated fat, not with refined carbohydrate.
Type | Main sources | What the guidance says |
|---|---|---|
Monounsaturated | Olive oil, avocado, almonds, peanuts | No intake limit. Favoured in place of saturated fat |
Polyunsaturated | Walnuts, flaxseed, chia, fatty fish, soybean and sunflower oil | Includes the two essential fats, which have adequate intakes, not limits |
Saturated | Butter, cheese, whole milk, fatty meat, coconut and palm oil | Under 10% of calories (Dietary Guidelines), about 6% (AHA) |
Trans | Small natural amounts in dairy and beef, plus industrial partially hydrogenated oils | Keep as low as possible. The FDA ended most use of partially hydrogenated oils, with a final compliance date of January 1, 2021 |
The next table converts both saturated fat limits to grams. They are ceilings, so a day under the number is fine. They sit inside your total fat figure, not on top of it.
Calories | 10% of calories, Dietary Guidelines ceiling | 6% of calories, AHA target |
|---|---|---|
1,200 | 13 g | 8 g |
1,500 | 17 g | 10 g |
1,800 | 20 g | 12 g |
2,044 | 23 g | 14 g |
2,500 | 28 g | 17 g |
3,000 | 33 g | 20 g |
At 2,044 calories the Dietary Guidelines ceiling of 23 g is about a third of the 68 g maintenance default. The AHA target of 14 g is about a fifth. Most of the remaining fat should come from unsaturated sources.
Fat in Common Foods
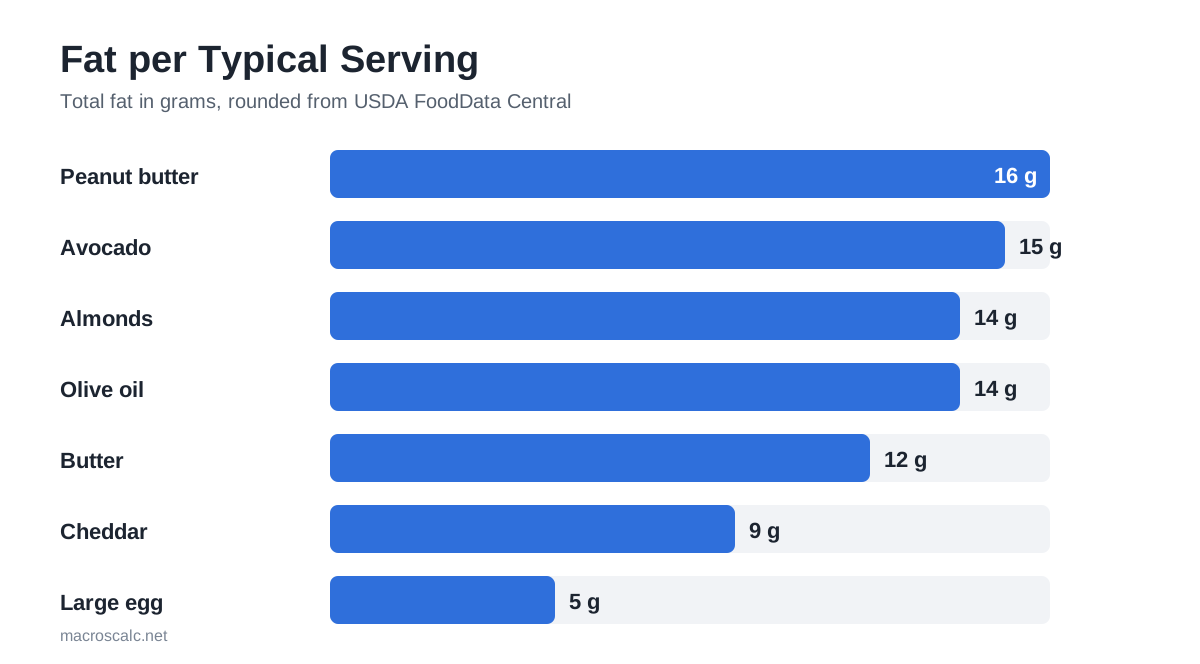
The table gives total and saturated fat for typical servings. Oils and spreads are almost pure fat. Foods such as an egg or a glass of whole milk bring protein and other nutrients too. Cooking oil and spreads are the most commonly missed fat when people log meals.
Food | Serving | Fat | Saturated fat | Calories |
|---|---|---|---|---|
Olive oil | 1 tbsp | About 14 g | About 2 g | 119 |
Butter | 1 tbsp | About 12 g | About 7 g | 102 |
Avocado | Half, about 100 g | About 15 g | About 2 g | 160 |
Almonds | 1 oz (28 g) | About 14 g | About 1 g | 164 |
Peanut butter, smooth | 2 tbsp | About 16 g | About 3 g | About 190 |
Cheddar cheese | 1 oz (28 g) | About 9 g | About 5 g | 114 |
Atlantic salmon, farmed, cooked | 100 g | About 12 g | About 2.4 g | About 206 |
Whole milk | 1 cup | About 8 g | About 5 g | 149 |
Large egg | 1 | About 5 g | About 1.6 g | 72 |
Values are rounded from USDA FoodData Central and vary by brand. A single tablespoon of olive oil is about a fifth of the 68 g maintenance default. That is why oil added in cooking can move a day’s total more than the main ingredient.
Worked Examples: Fat for a Man and a Woman
These examples use the maintain goal for the woman and the calculator defaults for each goal for the man. Protein is set per kg first. They show how the same 9 calories per gram conversion gives different fat for different bodies.
Each example converts calories to fat with calories × share ÷ 9. It then reads the result against the standard range and the saturated fat ceiling.
Example A: 70 kg Woman at Three Calorie Levels
At 1,500 calories she gets 50 g of fat, which is 30% of calories. At 2,044 calories she gets 68 g, also 30%. At 2,500 calories she gets 83 g, again 30%. Protein stays at 112 g in all three, so extra calories raise fat and carbohydrate together.
The carbohydrate side of the same budget is covered in how many carbs per day.
The official range at 2,044 calories is 45 to 79 g, so the 68 g default sits inside it. Her saturated fat ceiling at that level is 23 g under the Dietary Guidelines and 14 g by the AHA target.
Example B: 82 kg Man, Three Goals
A 28-year-old man at 180 cm and 82 kg gets 62 g of fat at the fat-loss default of 2,244 calories, or 25%. At maintenance of 2,806 calories he gets 94 g, or 30%. At the muscle-gain default of 3,086 calories he gets 86 g, or 25%. Protein is 164, 131 and 148 g in those three cases.
His maintenance fat of 94 g is 1.15 g per kg, and his lowest figure, 62 g, is 0.76 g per kg. All three sit above his 49 g floor and inside the 20% to 35% range. His saturated fat ceiling at maintenance is 31 g under the Dietary Guidelines and 19 g by the AHA target. Fat moves with calories and the chosen share, and carbohydrate absorbs the rest.
How to Interpret Your Daily Fat Intake
Treat your answer to how many grams of fat per day as a starting estimate. Use it for two to three weeks, then check the points below against your log.
Do not chase an exact figure. A day within about 10% of the target is close enough, and the weekly average matters more. If you have high cholesterol, a gallbladder condition or pancreatitis, set fat with a clinician. The numbers here are estimates for healthy adults.
FAQs
Conclusion
How many grams of fat per day comes down to calories and the share you choose. The standard range is 20% to 35% of calories. The calculator defaults to 30% at maintenance and 25% on other goals, and saturated fat stays under 10%.
Use the macro calculator to see your own number alongside protein and carbohydrate. For the protein side of the split, read how much protein per day, and for how the three fit together, read macro ratios.
Sources
The ranges and figures on this page come from the sources below and from USDA FoodData Central for food values. Check the originals if you plan to rely on a specific number.
Every worked example applies the same rules the macro calculator uses. Saturated fat ceilings are percentages of calories converted at 9 calories per gram.