How to Calculate BMR: Mifflin St Jeor, Harris Benedict, Katch McArdle
The Mifflin St Jeor equation estimates basal metabolic rate from weight, height, age and sex. It is the formula most dietitians and calculators use today. For a 35-year-old woman at 70 kg and 165 cm it returns 1,395 calories a day.
This page gives the exact constants for Mifflin-St Jeor, Harris-Benedict and Katch-McArdle. It compares all three on the same two people. It also shows the hand calculation in metric and imperial units. To skip the arithmetic, use the free macro calculator.
Mifflin St Jeor Equation: Formula and Constants
The Mifflin St Jeor equation comes from a 1990 study by Mifflin and colleagues in the American Journal of Clinical Nutrition. They measured resting energy expenditure in 498 healthy adults aged 19 to 78 and fitted a regression to weight, height and age. It was built to replace the Harris-Benedict equation, which had been fitted to data from the early 1900s and tended to overestimate for modern adults.
The formula is a straight sum, with one constant that differs by sex. Weight is in kilograms, height in centimetres and age in years.
Men: BMR = (10 × weight in kg) + (6.25 × height in cm) − (5 × age) + 5
Women: BMR = (10 × weight in kg) + (6.25 × height in cm) − (5 × age) − 161
The result is BMR, the energy your body uses at rest, not the calories you should eat. To get daily energy needs, multiply it by an activity factor, covered below and in BMR and TDEE. The Mifflin St Jeor equation uses no body fat input, which is both its strength and its limit.
Harris-Benedict: The 1919 Original and the 1984 Revision
Harris and Benedict published their equations in 1918 and 1919, and Roza and Shizgal revised the constants in 1984 using newer data. Many web pages mix the two versions without saying which, so always check which set a calculator uses. The original coefficients are below, with the revised set beside them.
Version | Men | Women |
|---|---|---|
Original (1919) | 66.47 + 13.75 × kg + 5.003 × cm − 6.755 × age | 655.1 + 9.563 × kg + 1.850 × cm − 4.676 × age |
Revised (Roza and Shizgal 1984) | 88.362 + 13.397 × kg + 4.799 × cm − 5.677 × age | 447.593 + 9.247 × kg + 3.098 × cm − 4.330 × age |
Both versions tend to read higher than Mifflin for the same person, by roughly 4 to 5% in the examples below. That fits the history. The original was fitted to a small sample from a century ago, and the revision only partly corrected for it.
Harris-Benedict still appears in textbooks and older tools, and it remains a reasonable estimate. If you compare your own numbers with a tool that uses it, expect a gap of about 60 to 100 calories a day against Mifflin-St Jeor. Constants are easy to mistype when copied between sites, so check them against the original source.
When Body Fat Is Known: Katch-McArdle
The Katch McArdle formula drops sex, height and age and works from lean body mass alone. Lean mass is body weight minus fat mass, so you need a body fat estimate. The formula is BMR = 370 + (21.6 × lean body mass in kg), where lean body mass = weight × (1 − body fat as a fraction).
This matters most for people whose build is far from average. A muscular person with the same weight as a sedentary one has more lean tissue, and Katch-McArdle gives them a higher BMR. The catch is accuracy. An error of 5 points in your body fat estimate moves the result by about 75 to 90 calories. A poor estimate can therefore be worse than the Mifflin St Jeor equation.
Other BMR Equations: Schofield, Cunningham and Owen
Several other equations appear on calculators, and they differ mainly in what they ask for. The Schofield equations, adopted by the WHO and FAO in 1985, use weight and age bands for each sex. They are known to overestimate in some populations. Owen published weight-only equations for men and women in the 1980s, and they are less common today.
Cunningham’s equation, BMR = 500 + (22 × lean body mass), follows the same logic as Katch-McArdle and is used mainly for athletes. For Example B below it gives 2,033 calories, which is 223 above Mifflin-St Jeor and shows why it suits very lean, muscular people only. The two Schofield bands used in this guide are shown in the table.
Schofield band | Equation (kcal per day) | Result for our example |
|---|---|---|
Women, 30 to 60 years | 8.126 × kg + 845.6 | 1,414 for Example A |
Men, 18 to 30 years | 15.057 × kg + 692.2 | 1,927 for Example B |
Mifflin St Jeor Equation vs the Alternatives: Same Person, Five Answers
The easiest way to see how the equations differ is to run them on the same people. These two profiles are the ones used across this site, and every figure below can be reproduced by hand. The Mifflin St Jeor equation is the baseline in each comparison.
Example A: 35-Year-Old Woman, 165 cm, 70 kg
Mifflin-St Jeor gives 1,395 calories. The revised Harris-Benedict gives 1,455 and the original gives 1,466. Schofield gives 1,414. Katch-McArdle at an assumed 25% body fat gives lean mass of 52.5 kg and a BMR of 1,504. The highest answer is 109 calories above the lowest, a spread of 7.8%.
Example B: 28-Year-Old Man, 180 cm, 82 kg
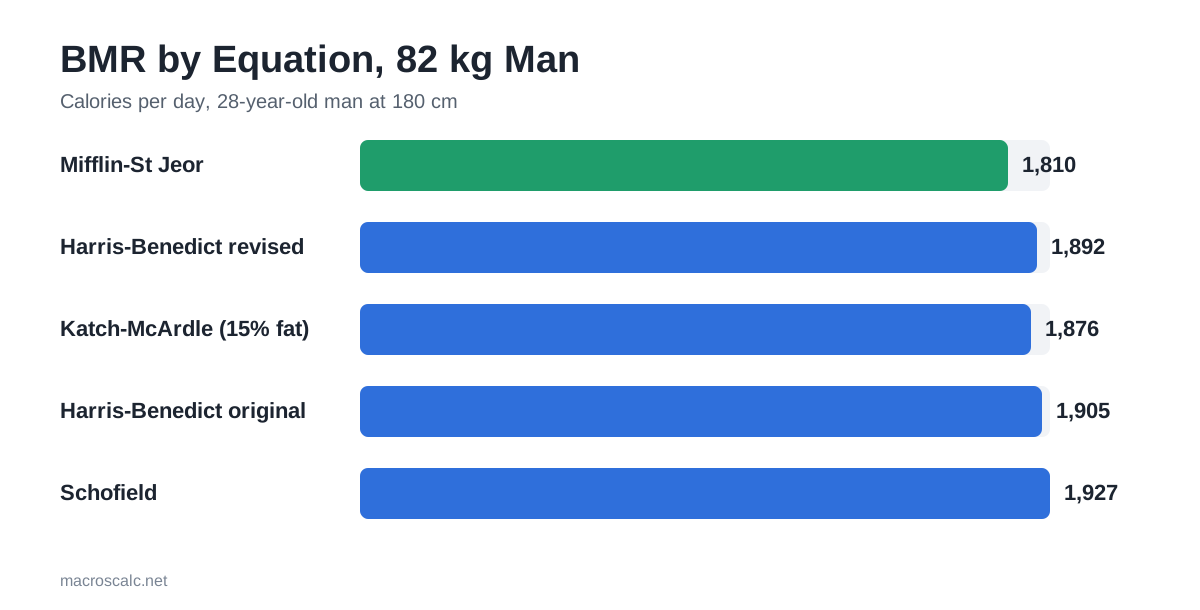
Mifflin-St Jeor gives 1,810 calories. The revised Harris-Benedict gives 1,892 and the original gives 1,905. Katch-McArdle at an assumed 15% body fat gives lean mass of 69.7 kg and a BMR of 1,876. Schofield gives 1,927. Here the spread is 117 calories, or 6.5%.
Example C: How Wide Is the Spread?
The table lines up every result against the Mifflin St Jeor equation. Percentages are the difference from that baseline.
Equation | Woman (A) | vs Mifflin | Man (B) | vs Mifflin |
|---|---|---|---|---|
Mifflin St Jeor equation | 1,395 | baseline | 1,810 | baseline |
Schofield | 1,414 | +19 (+1.4%) | 1,927 | +117 (+6.5%) |
Harris-Benedict revised | 1,455 | +60 (+4.3%) | 1,892 | +82 (+4.5%) |
Harris-Benedict original | 1,466 | +71 (+5.1%) | 1,905 | +95 (+5.2%) |
Katch-McArdle (25% and 15% body fat) | 1,504 | +109 (+7.8%) | 1,876 | +66 (+3.6%) |
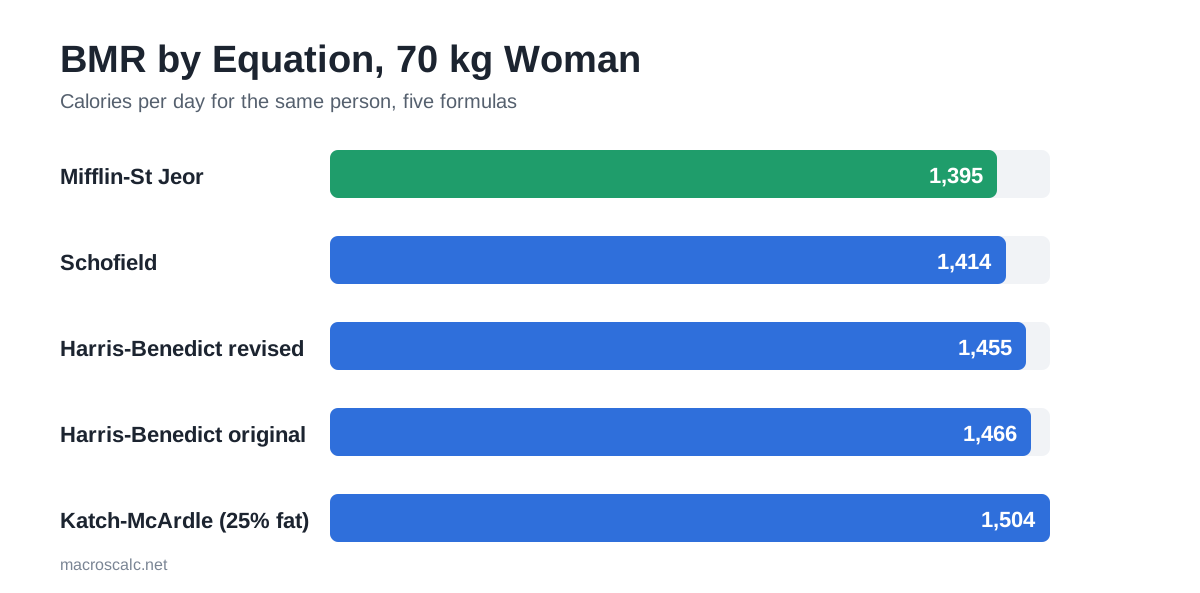
Mifflin-St Jeor sits at the bottom of every comparison here. That is expected, because it was fitted to more recent data, and it is why it is the usual default. Keep in mind that the Katch-McArdle numbers depend on body fat values that were assumed, not measured.
The chart repeats the comparison for the man in Example B, where the spread is 117 calories.
Calculating BMR by Hand, Step by Step
A hand calculation takes under a minute. Take the woman from Example A and work through Mifflin-St Jeor in metric units.
For the man in Example B, the same steps give 820 + 1,125 − 140 + 5 = 1,810. If you prefer imperial units, use the equivalent form. BMR = (4.536 × weight in lb) + (15.875 × height in inches) − (5 × age) + 5 for men, or − 161 for women.
Same Calculation in Pounds and Inches
The imperial version gives the same answer within a few calories. For the woman in Example A, who weighs 154 lb and is 65 inches tall, the steps are 4.536 × 154 = 698.5, then 15.875 × 65 = 1,031.9, then 698.5 + 1,031.9 − 175 − 161 = 1,394. The small gap from 1,395 comes from rounding her weight and height.
For the man in Example B, who weighs 181 lb and is 71 inches tall, the steps are 4.536 × 181 = 821.0, then 15.875 × 71 = 1,127.1, then 821.0 + 1,127.1 − 140 + 5 = 1,813. That is 3 calories above the metric result of 1,810, again from rounding the inputs.
From BMR to Daily Calories: Activity Multipliers
BMR is the base of your energy estimate, not the end. Multiplying it by an activity factor gives total daily energy expenditure, or TDEE. The calculator offers six factors, from sedentary at 1.2 to extra active at 1.9.
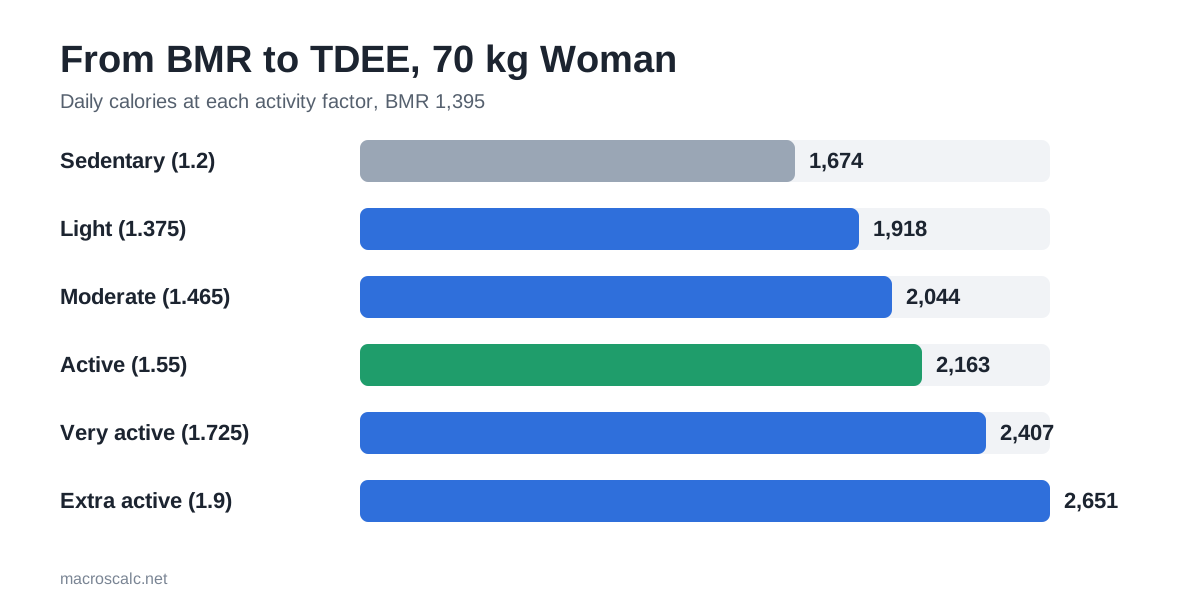
The table applies each factor to the two examples. At 1.55, the woman in Example A reaches 2,163 calories and the man in Example B reaches 2,806. Those are the numbers the macro examples across this site start from.
Activity level | Factor | Woman (A) | Man (B) |
|---|---|---|---|
Sedentary: little to no exercise | 1.2 | 1,674 | 2,172 |
Light: exercise 1 to 3 times a week | 1.375 | 1,918 | 2,489 |
Moderate: exercise 4 to 5 times a week | 1.465 | 2,044 | 2,652 |
Active: daily exercise or 3 to 4 intense sessions | 1.55 | 2,163 | 2,806 |
Very active: intense exercise 6 to 7 times a week | 1.725 | 2,407 | 3,122 |
Extra active: physical job or two sessions a day | 1.9 | 2,651 | 3,439 |
Most people overrate their activity, so choose the lower level if you are between two. The full method is in BMR and TDEE.
The chart turns the woman in Example A into daily energy at each activity level.
Which BMR Equation to Use
Use the Mifflin St Jeor equation when you do not know your body fat. A systematic review by Frankenfield and colleagues in 2005 compared common equations against measured values. Mifflin-St Jeor predicted within 10% of measured resting energy expenditure for about 82% of non-obese adults. No predictive equation is exact, but this one is the most reliable default.
Switch to Katch-McArdle when you have a body fat figure you trust, such as from a DEXA scan. It is also the better choice for very lean or very muscular people. In clinical settings, or for older adults with low muscle mass, measured resting energy expenditure is better than any equation.
Adults With Obesity
The same review found that Mifflin-St Jeor was within 10% of measured values for about 70% of adults with obesity. That is lower than for non-obese adults, but it was still the best of the equations compared. Body fat in Katch-McArdle can help when it is measured, but a guessed value does not.
Limits of the Mifflin St Jeor Equation
The Mifflin St Jeor equation was fitted on healthy adults aged 19 to 78, so it is least reliable outside that group. Very lean or very muscular people, very high body fat levels and people with medical conditions can all sit well away from the predicted value. Older adults with low muscle mass often have a lower measured resting rate than any equation predicts.
The error is also random in direction. For most adults the prediction is within 10% of the measured value, which in the examples above is 140 to 180 calories. That is why a two to three week check against your weight trend matters more than choosing between equations.
Interpreting the Gap Between Equations
A spread of 60 to 120 calories in BMR becomes 90 to 180 calories in daily energy once you multiply by an activity factor of 1.55. That is real but small next to the error in the activity factor itself. Treat any equation’s output as a starting point and adjust it against your weight trend over two to three weeks.
If the equations disagree by much more than 10%, check your inputs first. Height in inches entered as centimetres, weight in pounds entered as kilograms and body fat that is too high or low account for most large gaps.
How This Calculator Uses These Equations
The macro calculator uses the Mifflin St Jeor equation by default and switches to Katch-McArdle when you enter body fat. It then applies your activity factor and the goal you choose. If you already know your daily calories, you can enter them and skip the estimate entirely.
The exact constants, rounding rules and calorie floors are listed on the methodology page, so you can check any number against this page. For what to do with the result, see how to calculate macros. If you are cutting, macros for weight loss covers the deficit. If you are gaining, see macros for muscle gain.
Common BMR Calculation Mistakes
Most BMR errors come from units or from reading BMR as a diet target. Each one below is easy to avoid once you know it. The table lists the mistakes that move a result the most.
Mistake | Effect | Fix |
|---|---|---|
Entering pounds in a kilogram field | Result roughly doubles | Divide pounds by 2.2 first |
Mixing Harris-Benedict versions | Gap of 10 to 15 calories | Check which constants a tool uses |
Using a guessed body fat in Katch-McArdle | Error of about 15 to 18 calories per point | Measure it or use the Mifflin St Jeor equation |
Eating at BMR | Too few calories for most people | Multiply by an activity factor first |
Treating the result as exact | False precision of 100 or more calories | Adjust from your weight trend |
If a result looks wrong, recheck units before you question the equation.
FAQs
Conclusion
The Mifflin St Jeor equation is the best default for estimating BMR when you do not have a body fat measurement. Use Harris-Benedict only to compare with older tools. Use Katch-McArdle when your lean mass is known.
The equation is the first step, not the last. Run your numbers in the macro calculator, then adjust against your weight trend. If you want the bigger picture, read what are macros next.
Sources
The constants and accuracy figures on this page come from the papers below, plus the Schofield coefficients as published in the WHO and FAO report. Check the originals if you plan to rely on a specific number, and confirm the Schofield age band that matches yours.