Macro Ratios Explained: How to Pick Your Split
Macro ratios express protein, carbohydrate and fat as shares of your daily calories. A 30/40/30 split means 30% protein, 40% carbohydrate and 30% fat. The ratio sets proportions, not grams, so the same split gives different amounts at different calorie levels. On a 2,044-calorie day, that example is 153 g protein, 204 g carbohydrate and 68 g fat.
This page shows the common ratios converted to grams, which macro split fits which goal, and why very high protein shares get flagged. It also explains how to turn a ratio you were given into grams per kg and how to tell whether it is working. To set your own split, use the free macro calculator.
Macro Ratios: What They Are and How to Read Them
A ratio divides your daily calories into three shares. Protein and carbohydrate each provide 4 calories per gram and fat provides 9, so every percentage converts to grams with one formula: calories × share ÷ calories per gram. The basics of each nutrient are covered in what are macros.
Two cautions apply before you compare any numbers. The first is order. This page writes all macro ratios as protein, carbohydrate, fat, while many diet sites write carbohydrate, protein, fat. A 40/30/30 plan can therefore mean two different things on two different pages.
The second caution is that a macro split is a share, not an amount. It says how your calories are divided and nothing about how many you eat. Two people on the same ratio can be eating very different grams, which is why the sections below keep returning to grams per kg of body weight.
The Common Macro Ratios in Grams
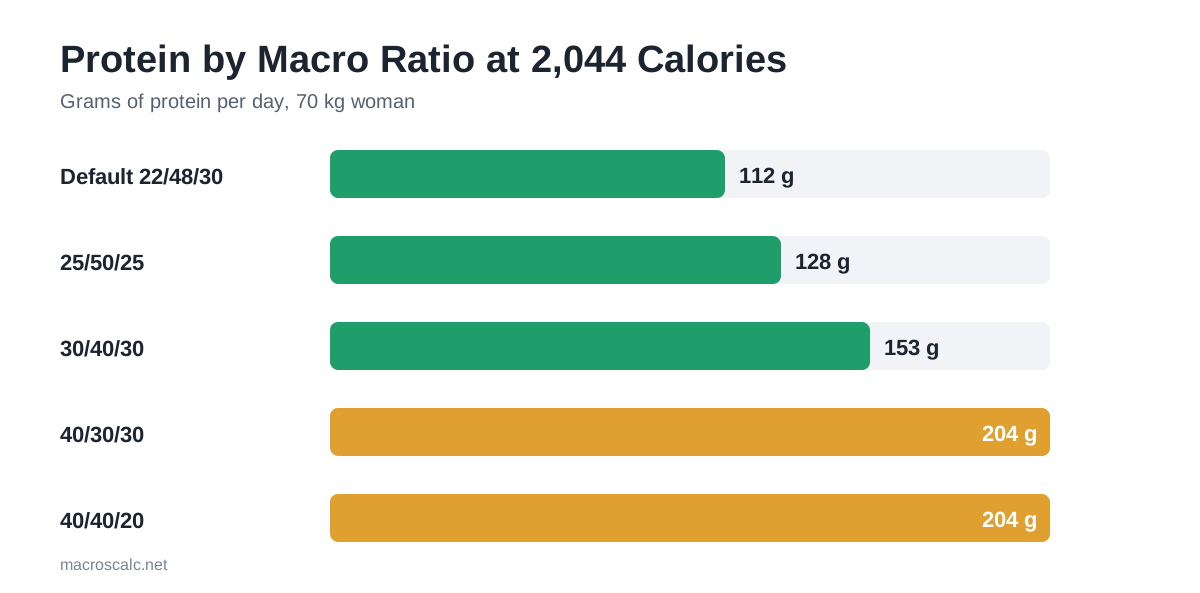
The table converts six common splits to grams at 2,044 calories, the maintenance level of a 35-year-old woman at 165 cm and 70 kg with a moderate activity factor of 1.465. The first row is the calculator’s maintenance default. The last column is protein per kg of body weight, the number to read first.
Ratio (protein / carbs / fat) | Protein | Carbohydrate | Fat | Protein per kg |
|---|---|---|---|---|
Calculator default, 22 / 48 / 30 | 112 g | 246 g | 68 g | 1.6 g/kg |
25 / 50 / 25 | 128 g | 256 g | 57 g | 1.8 g/kg |
30 / 40 / 30 | 153 g | 204 g | 68 g | 2.2 g/kg |
30 / 50 / 20 (sold as 50/30/20 macros) | 153 g | 256 g | 45 g | 2.2 g/kg |
40 / 30 / 30 | 204 g | 153 g | 68 g | 2.9 g/kg, flagged |
40 / 40 / 20 | 204 g | 204 g | 45 g | 2.9 g/kg, flagged |
Sources that write carbohydrate first call the 30/50/20 row a 50/30/20 split (the 50 30 20 macros plan), meaning 50% carbohydrate, 30% protein and 20% fat. The popular 40 40 20 macros plan (written 40/40/20) is 40% carbohydrate, 40% protein and 20% fat in the same convention. Both rows above are converted from the order used on this page.
Many people hit these splits flexibly, as IIFYM explains.
The first four rows keep protein between 1.6 and 2.2 g per kg, which matches the range most sports nutrition guidance supports. The last two rows push protein to 2.9 g per kg for this profile, and the calculator flags them. The next sections explain why.
Which Macro Ratios Fit Which Goal
No single macro ratio is best for everyone, because the goal changes calories and calories change what a percentage means. A better question is which protein target fits your goal, then what share of calories that works out to. The goal guides give the full method: macros for weight loss covers the deficit side and macros for muscle gain covers the surplus side.
The table shows why one protein target produces different shares. The protein per kg is similar across goals, but calories are not, so the protein share swings from 19% to 32%.
Goal | Profile | Calories | Protein | Protein share |
|---|---|---|---|---|
Fat loss | Woman, 70 kg | 1,730 | 140 g | 32% |
Maintenance | Woman, 70 kg | 2,044 | 112 g | 22% |
Recomposition | Woman, 70 kg | 2,163 | 140 g | 26% |
Muscle gain | Man, 82 kg | 3,086 | 148 g | 19% |
Fat Loss
In a deficit, calories are low, so a fixed protein target takes a larger share. That is why fat-loss plans often land near 30% protein even though the target is simply 2.0 g per kg. Fat sits near 25% to 30% and carbohydrate takes the rest.
Muscle Gain
In a surplus, calories are high, so the same protein target is a smaller share and carbohydrate takes most of the extra energy. A split near 19% protein, 56% carbohydrate and 25% fat is typical for a lifter on a 10% surplus. The reasoning is laid out in the muscle gain guide.
For the gram side of each share, see how many carbs per day and how many grams of fat per day.
The full surplus method is in macros for muscle gain.
Maintenance and Recomposition
Maintenance uses the middle of the protein range, which gives about 22% protein, 48% carbohydrate and 30% fat for the reference woman. Recomposition keeps calories at maintenance and raises protein to 2.0 g per kg, which moves the protein share up to about 26%.
Keto
Very low carbohydrate plans invert the usual order, with fat as the largest share. A 70% fat, 25% protein and 5% carbohydrate split is the usual starting point, and the grams are worked out in the keto macros guide.
Why Protein Above 35% of Calories Gets Flagged
The calculator’s standard mode caps protein at 35% of calories, and its custom mode keeps whatever you type but shows a flag above that line. The cap matches the top of the National Academies range for protein, which runs from 10% to 35% of calories for adults. A flag is a prompt to check the grams, not an error.
The reason is easy to see in the 40/30/30 and 40/40/20 rows. At 2,044 calories, 40% protein is 204 g, which is 2.9 g per kg for a 70 kg adult. That is well above the 1.4 to 2.0 g per kg that the International Society of Sports Nutrition calls enough for most exercising people.
Morton and colleagues found in 2018 that extra protein stopped adding to strength-training gains near 1.6 g per kg, with an upper confidence limit of 2.2 g per kg. Extra protein beyond that mostly crowds out carbohydrate and fat without a clear return. People with kidney disease or other medical conditions should not set a high protein target from a web page and should ask a clinician.
Why Percentages Mislead at Low and High Calories
Macro ratios are only as good as the calories under them. At 1,200 calories, a 20% protein share is 60 g, which is 0.9 g per kg for a 70 kg adult and barely above the 0.8 g per kg RDA. At 3,000 calories the same 20% share is 150 g, or 2.1 g per kg.
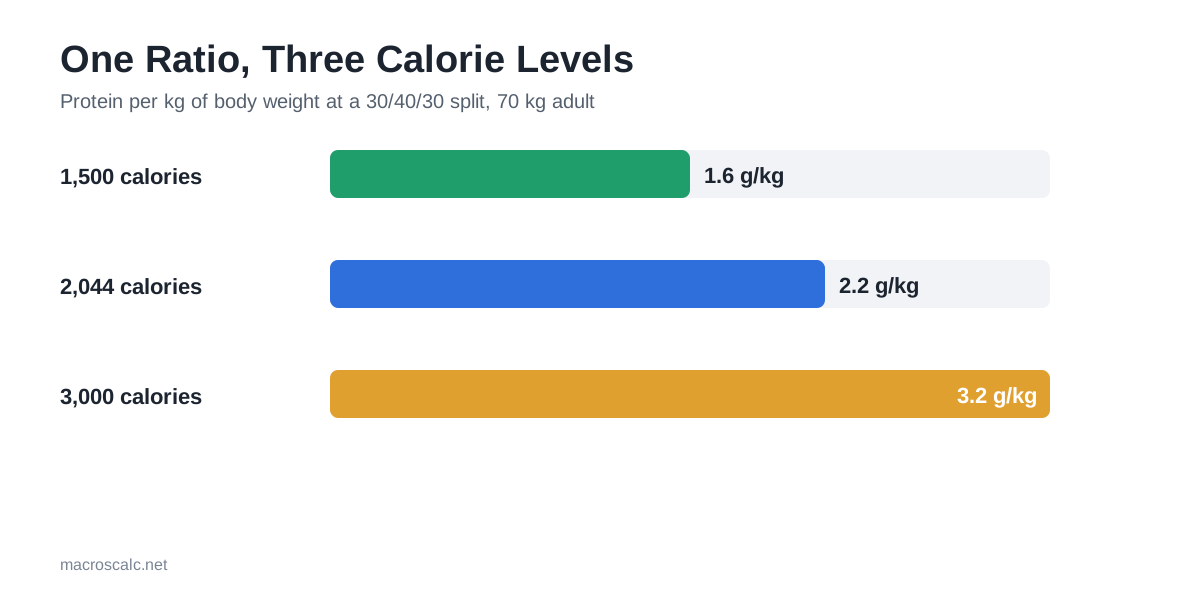
The table repeats a 30/40/30 split at three calorie levels for the same 70 kg adult. The percentages never change, yet protein moves from a sensible 1.6 g per kg to a very high 3.2 g per kg.
Calories | Protein (30%) | Carbohydrate (40%) | Fat (30%) | Protein per kg |
|---|---|---|---|---|
1,500 | 113 g | 150 g | 50 g | 1.6 g/kg |
2,044 | 153 g | 204 g | 68 g | 2.2 g/kg |
3,000 | 225 g | 300 g | 100 g | 3.2 g/kg |
Read it as a rule of thumb. A fixed macro ratio fits a narrow band of calories and body weights, and outside that band the grams drift from what the body needs. People who diet at low calories or eat at high calories are the ones most likely to be misled.
A Protein-First Method for Setting Your Macro Split
The alternative to starting from macro ratios is to start from grams. Protein is set per kg of body weight, fat is set as a share of calories, and carbohydrate takes the remainder. The calculator works this way in standard mode, and the resulting macro ratios are outputs, not inputs.
Applied to the reference woman at 2,044 calories, protein is 112 g at 1.6 g per kg and fat is 68 g at 30% of calories. Carbohydrate is the remaining 246 g. That is a 22/48/30 split, which differs from 30/40/30 by 41 g of protein and 42 g of carbohydrate.
Neither is wrong, and both land inside the supported protein range. The protein-first route simply guarantees the protein target, so the ratio cannot drift when calories change. The full protein reasoning is in how much protein per day, and the calorie step is in how to calculate macros.
Your Split Against the Official Ranges
The National Academies Acceptable Macronutrient Distribution Ranges give a reference band for each nutrient. Adults are advised to take 10% to 35% of calories from protein, 45% to 65% from carbohydrate and 20% to 35% from fat. The ranges describe patterns linked with lower chronic disease risk, so they are a health guide and not a performance target.
The chart converts those limits to grams at 2,044 calories. Protein runs from 51 to 179 g, carbohydrate from 230 to 332 g and fat from 45 to 79 g. A split is within the official ranges when all three shares sit inside these bands. The gap between low and high ends shows how much room there is.
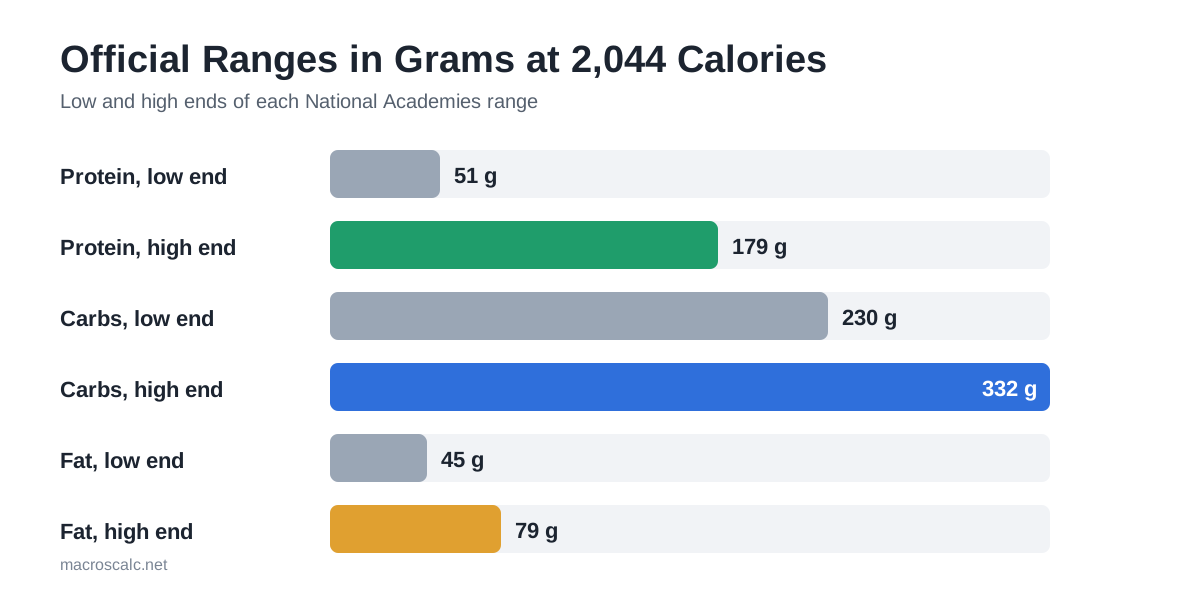
The common macro ratios mostly fit. A 30/50/20 split passes on all three nutrients, and so does 25/50/25. The 30/40/30 split falls just under the carbohydrate range at 40%, while its protein and fat sit inside. The 40% protein plans fail on protein, which is the same reason the calculator flags them.
Worked Examples: One Ratio on Three Bodies
These three profiles show how one macro ratio turns into different grams and different protein per kg. Each uses maintenance calories from the calculator and the order protein, carbohydrate, fat.
Example A: 70 kg Woman at 2,044 Calories
A 30/40/30 split gives 153 g protein, 204 g carbohydrate and 68 g fat, which is 2.2 g per kg. That sits at the top of the usual range and is safe to use. The calculator default for her is 22/48/30, so she can keep the round percentages or take the lower protein.
Example B: 82 kg Man at 2,806 Calories
The same 30/40/30 split gives 210 g protein, 281 g carbohydrate and 94 g fat. Protein is 2.6 g per kg, above the supported range, while the calculator default of 131 g is 19% of his calories. Macro ratios that suit the woman can overshoot for the man because his calories are higher.
Example C: 55 kg Woman at 1,500 Calories
A 25/50/25 split gives 94 g protein, 188 g carbohydrate and 42 g fat, or 1.7 g per kg. Switch to 40/30/30 at the same calories and protein becomes 150 g, or 2.7 g per kg, with only 113 g of carbohydrate. Low calories turn a high-protein share into very high protein per kg.
In all three cases the macro ratio looks reasonable on paper, and only grams per kg reveal the problem. Check that number before you commit to any split.
Adjusting Your Split for Your Body and Diet
Macro ratios are a starting point that needs a check against your body size, age and food choices. The three cases below are where a copied macro split most often needs changing.
Smaller Bodies and Lower Calories
Women and smaller adults usually eat fewer calories, so percentages give lower grams. A 25% protein share at 1,500 calories is 94 g, which is 1.3 g per kg for a 70 kg adult and below the default. Use grams per kg as the floor and let the percentage follow.
Older Adults
The PROT-AGE study group recommends 1.0 to 1.2 g per kg for healthy adults over 65. Calories often fall with age, so the protein share rises even at modest grams. Protein per meal matters as well, with 25 to 30 g per meal suggested.
Vegetarians and Vegans
Plant-based diets lean on legumes, grains and soy, which carry more carbohydrate per gram of protein. A split with a low carbohydrate share can be hard to follow on these diets. Starting from the protein target in grams and letting carbohydrate fill the rest is simpler.
How to Interpret a Ratio You Were Given
Coaches, apps and diet books often hand out macro ratios without the calories behind them. Convert them before you follow them. Multiply your calories by each share, divide by 4 for protein and carbohydrate or by 9 for fat, then divide the protein by your weight in kg.
Take a 40/30/30 plan at 2,500 calories for an 82 kg man. Protein is 2,500 × 0.40 ÷ 4 = 250 g, which is 3.0 g per kg. That is far above the supported range, so the right response is to lower the protein share, not to eat 250 g.
If the grams per kg land between 1.6 and 2.2, the ratio is safe to use as given. If they land outside, adjust the protein share and let carbohydrate absorb the change. Your own plan can be built and compared in the macro calculator, which shows the percentage and the grams side by side.
How to Tell Whether a Ratio Is Working
Judge your macro ratios after two to three weeks, not after two to three days. Use the weekly average of your morning weight, your training performance and your hunger, not a single weigh-in. Day-to-day changes in water and glycogen hide the real trend.
Most problems turn out to be calorie problems, not problems with the macro ratios themselves. Change calories first, by 100 to 150 a day, and touch the split only if a specific symptom points to it. The table lists the common signals and the first fix to try.
Signal | What it suggests | First fix |
|---|---|---|
Weight not moving as planned | Calories are off, not the macro ratios | Change calories by 100 to 150 a day |
Hungry all day | Protein or fibre is low | Raise protein toward 2.0 g/kg and add vegetables |
Hard sessions feel flat | Carbohydrate is low | Move calories from fat to carbohydrate |
Cannot hit the protein number | Target is higher than your food allows | Move toward 1.6 g/kg or add a protein food at each meal |
Swinging between days | Plan is too rigid | Aim for within 10% of target on most days |
If you track your food, the routine in how to count macros keeps the logging simple. Tracking is a tool for checking your numbers, not a requirement to log forever.
FAQs
Conclusion
Macro ratios are shares of calories, so they only make sense once you convert them to grams and check protein per kg. The common splits sit near the supported ranges, except the 40% protein plans that the calculator flags and 30/40/30, which is a little low on carbohydrate. Start from the protein target and let the macro ratios follow.
To see your own split in grams and percentages, use the macro calculator. If you want the full method behind the numbers, read how to calculate macros, and for protein detail see how much protein per day.
Sources
The ranges and figures on this page come from the sources below. Check the originals if you plan to rely on a specific figure, because ranges differ slightly between reviews.
Every worked example above was calculated with the same engine the macro calculator uses, so you can reproduce each figure with the same inputs. All macro ratios are written in the order protein, carbohydrate, fat.